ASCII Mandelbrot animation
Years ago, when I was programming in PL/1 on an OS/390 platform, I used some of the breaks for improving my PL/1 programming skills. One day I decided it would be fun to try to get an animated Mandelbrot fractal zoom working on a mainframe terminal. Recently I created a similar project for a Console application, which I will describe in this blog post.
Before we delve into the nitty gritty details of the code, first a small intro into the world of fractals.
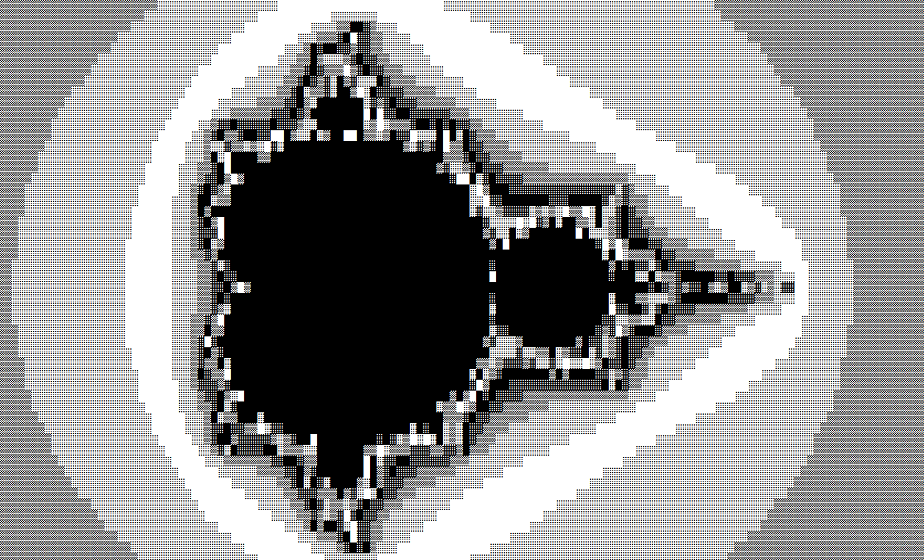
One of the most famous is the Mandelbrot set (see the image below), which was named after Benoit Mandelbrot
 The Mandelbrot set can be explained with the equation
. In that equation,
and
are complex numbers and
is zero or a positive integer (natural number). Starting with
,
is in the Mandelbrot set if the absolute value of
never becomes larger than a certain number (that number depends on
), no matter how large
gets.
Images are created by applying the equation to each pixel in an iterative process, using the pixel's position in the image for the number ' '. ' ' is obtained by mapping the position of the pixel in the image relative to the position of the point on the complex plane.
More iterations per pixel will take longer to process, but yield a fractal pattern with a higher detail. The animation below shows the Mandelbrot set based on a static number of iterations per pixel:

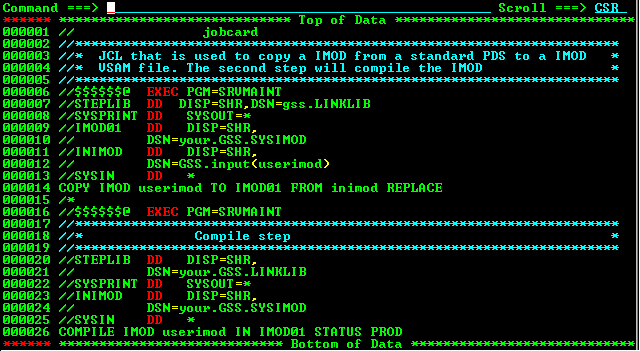
The solution was to convert the calculated Mandelbrot output to corresponding ASCII-shades and store them in a file. In this file each X amount of lines provided a full frame of the animation for a terminal window with a height of X rows. Animating was as simple as scrolling through the file page-by-page.
 This inspired me to create a similar solution inside a Windows console application.
The 'pages' are calculated on a row-per-row basis and as soon as a full frame is calculated, the entire buffer is written to the console window for display. After this, the new zoom-factor is determined and the next page is calculated.
In pseudo-code of this main loop is as follows:
In pseudo-code calculating a row looks as follows:
If all goes well, the first few frames of your animation should look like this:
 Practicing your programming skills may not always be about writing great code, but rather finding fun challenges and puzzles to conquer. I'm always curious to know which ones other people came up with, so let me know in the comments below!
Before we delve into the nitty gritty details of the code, first a small intro into the world of fractals.
Mandelbrot set
In mathematics, Fractals are abstract objects used to describe and simulate naturally occurring objects. Like the natural fern in the title image, artificially created fractals show similar patterns at increasingly small scales. Looking close at the fern leaf, it seems to consist of smaller copies of itself.One of the most famous is the Mandelbrot set (see the image below), which was named after Benoit Mandelbrot

Images are created by applying the equation to each pixel in an iterative process, using the pixel's position in the image for the number ' '. ' ' is obtained by mapping the position of the pixel in the image relative to the position of the point on the complex plane.
More iterations per pixel will take longer to process, but yield a fractal pattern with a higher detail. The animation below shows the Mandelbrot set based on a static number of iterations per pixel:

Programming the OS/390
Getting animations to work on a terminal system which requires a server round-trip for each displayed page, is not an easy task; especially when ASCII-characters are the only means of drawing available. In fact, the only way to do it, is to cheat a bit.The solution was to convert the calculated Mandelbrot output to corresponding ASCII-shades and store them in a file. In this file each X amount of lines provided a full frame of the animation for a terminal window with a height of X rows. Animating was as simple as scrolling through the file page-by-page.

Console application
For a console application, the approach is similar in the sense that we use ASCII-character to represent the shading of the fractal. However, no server round-trip is required and we can output directly to the screen.The 'pages' are calculated on a row-per-row basis and as soon as a full frame is calculated, the entire buffer is written to the console window for display. After this, the new zoom-factor is determined and the next page is calculated.
In pseudo-code of this main loop is as follows:
while (we did not reach the maximum Zoomfactor)
{
    // Calculate the y-coordinates involved in the current zoom Factor

    // For each of these y-coordinates, calculate the entire row and add it to the frame

    // Clear the console window and draw the calculated frame

    // Recalculate the Zoomfactor
}
In pseudo-code calculating a row looks as follows:
// Determine the x-coordinates to calculate

// For each x,y-coordinate do the following:
//      Calculate the c-value for that coordinate
//        Determine the ASCII-shade for that value

// Return the row
Main loop
Let's take a look at the code for the main loop. Note that this C# code is not fully optimized in order to keep the code in one single method.private static void DrawFractal()
{
const double StopfactorZoom = 0.00000000000005; // At this zoom-factor we stop
const double StopfactorShr = 0.7496494959997; // Higher number = to the right, Lower = to the left
const double StopfactorShu = 0.03000094443895; // Higher number = Down, Lower = up
const double ZoomSpeed = 0.85; // Between 0 and 1: zoom in, > 1: Zoom out
const double YCenter = 0.95;
const double YStep = 0.5;
var zoomFactor = 0.9;
var yLines = Console.WindowHeight - 2;
var yMin = YCenter - (yLines / 2f) * YStep;
var yMax = YCenter + (yLines / 2f) * YStep;
while (zoomFactor > StopfactorZoom)
{
// Calculate the y-coordinates involved in the current zoom Factor
var shiftRight = zoomFactor > StopfactorShr ? zoomFactor / ZoomSpeed : StopfactorShr;
var shiftUp = zoomFactor > StopfactorShu ? zoomFactor / ZoomSpeed : StopfactorShu;
var yCoords = new List();
for (var y = yMax * zoomFactor - shiftUp; y >= yMin * zoomFactor - shiftUp; y -= YStep * zoomFactor)
{
yCoords.Add(y);
}
// For each of these y-coordinates, calculate the entire row and add it to the frame
var grid = new string[yCoords.Count];
var tempFactor = zoomFactor;
Parallel.For(0, yCoords.Count - 1, i =>
{
grid[i] = CalculateRow(yCoords[i], tempFactor, shiftRight);
});
// Clear the console window and draw the calculated frame
Console.Clear();
foreach (var line in grid)
{
Console.WriteLine(line);
}
// Recalculate the Zoomfactor
zoomFactor = zoomFactor * ZoomSpeed;
}
}- Lines 3 - 8 are constants that determine the Y coordinate for the center of the zoom, the zoom speed and when to stop animating. Without the stop-condition, the animation would play until eternity.
- Line 13 - 26 determine the y-coordinates that are involved in the current zoom level. These are redetermined for each zoom-action.
- Line 29 defines the grid in which each row will be stored. A row is a string of ASCII-characters representing the shades of the coordinates on that row.
- In lines 30 - 34 all x-coordinates are calculated for the given y-coordinate, resulting in a row (string), which is stored in the grid in line 33.
- Lines 37 - 41 reset the console window and output the grid to screen in a row-by-row fashion.
CalculateRow
private static string CalculateRow(double y, double factor, double shiftRight)
{
    const double XCenter = -0.45;
    const double XStep = 0.3;
    const int MaxIterations = 50;

    var shades = new[] { ' ', '\u2591', '\u2592', '\u2593', '\u2588', '\u2593', '\u2592', '\u2591' };

    var xLines = Console.WindowWidth - 2;
    var xMin = XCenter - xLines / 2f * XStep;
    var xMax = XCenter + xLines / 2f * XStep;

    var xCoords = new List();

    // Determine X-coordinates to calculate
    for (var x = xMin * factor + shiftRight; x <= xMax * factor + shiftRight; x += XStep * factor)
    {
        xCoords.Add(x);
    }

    var row = new char[xCoords.Count];

    Parallel.For(0, xCoords.Count - 1, i =>
    {
        // Calculate the mandelbrot-value for the x,y-coordinate
        var x = xCoords[i];
        var iterations = 0;
        var xTemp = x;
        var yTemp = y;
        var arg = Math.Pow(x, 2) + Math.Pow(y, 2);

        while (arg < shades.Length && iterations < shades.Length * MaxIterations)
        {
            var xSqr = Math.Pow(xTemp, 2);
            var ySqr = Math.Pow(yTemp, 2);

            yTemp = 2 * xTemp * yTemp - y;
            xTemp = xSqr - ySqr - x;

            arg = xSqr + ySqr;
            iterations++;
        }

        //Determine the ASCII-shade for that value
        row[i] = shades[iterations % shades.Length];
    });

    return new string(row);
}- Lines 3-5 are the constants that determine the zoom parameters for the X-coordinate and the maximum number of iterations for each pixel (see the previous paragraph on the Mandelbrot set).
- Line 7 is the character-set for the ASCII shades in Unicode. Note that this list is circular (not palindromic since the space is not present at the end) to allow a modular approach when determining the correct shade for a given value.
- Lines 9 - 19 determine the x-coordinates that are involved in the current zoom level analogous to the y-coordinates in the main loop.
- Line 23 makes sure that each x-coordinate in the row is processed in parallel.
- Lines 32 - 42 calculate the c-value for the specific x/y-coordinate limited by the maximum number of iterations.
- In line 45 the ASCII-shade for the calculated c-value is determined.
If all goes well, the first few frames of your animation should look like this:

No comments:
Post a Comment